
Data Analytics
This section will contain a collection of things regarding data analysis. It will serve as a top-level index page.
Resources
Excel
This section will be where I store information embracing the capabilities of Excel for data analysis, financial modeling, and business intelligence.
Excel
Why Excel? My goal is not just to learn a spreadsheet tool but to unlock a new realm of possibilities in data management and analysis. Whether it’s understanding financial trends or optimizing business operations. I want to build a strong foundation in spreadsheet manipulation, master the art of data visualization, and eventually explore advanced features like macros and pivot tables. I am intrigued by the stories of Excel enhancing productivity and providing strategic insights, and I hope to be one of those stories.
Motivations for Learning Excel
Business Analysis: Business analysis is fascinating because it’s about turning raw data into strategic insights and informed decisions. With Excel, features like pivot tables and advanced charting can help dissect and visualize data in ways that inform and persuade. It’s about extracting actionable intelligence from numbers, and that’s something I really look forward to mastering.
Financial Modeling: Financial modeling is another area I’m eager to delve into. It’s about constructing representations of a company’s financial performance. With Excel’s functions and formulas, the ability to model complex financial scenarios becomes possible. From budget forecasting to investment analysis, the potential applications are vast and impactful.
Resources
- Exceljet Exceljet provides concise Excel tips, tutorials, and shortcuts.
- Datacamp Excel cheatsheet provided by Datacamp.
- Excel Practice Website to practice and learn excel functions and tools on the browser window. Every function and tool has an explanation followed by an online excel exercise which can be solved within the page itself, no need to download anything.
- Pluralsight Excel
Pluralsight Excel
Notes from the Pluralsight course on Excel 365, detailing key features and functionalities essential for mastering Excel in a professional setting.
Pluralsight Excel 365 Training
Formatting
Discusses the importance of cell formatting for readability and data interpretation. Key topics include number formatting, cell styles, and custom formats.
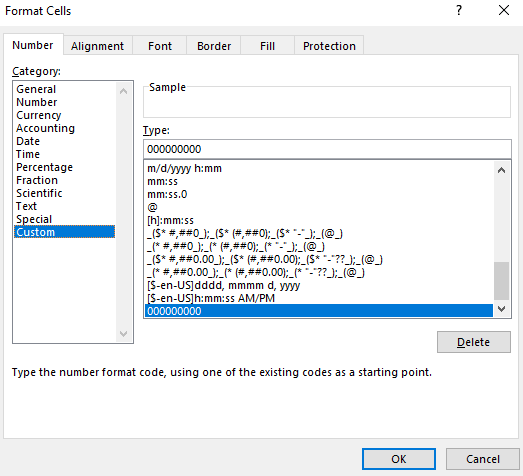
Custom Number Formats
Use Cases
- Specific number formatting (Date, Time, Decimals, Accounting, Percentage, etc..)
- Data from csv file need to be formatted for analysis in 3rd party application (Leading Zeros).
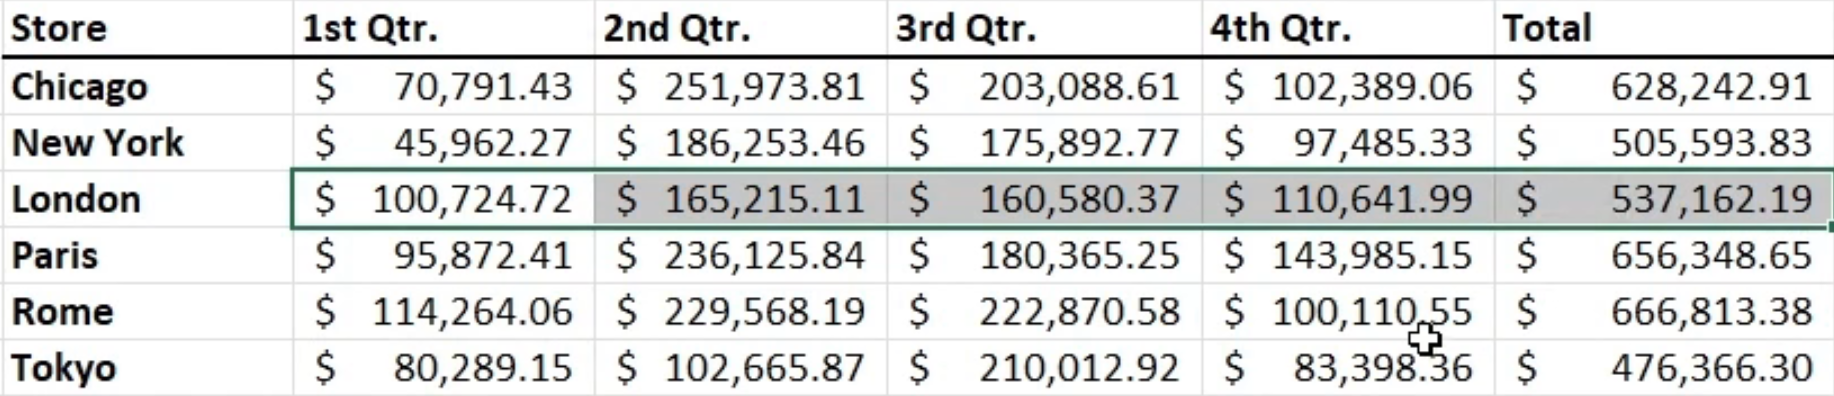
International Currency Formats
Symbols for Different Currency
Accounting Formats (Does not do conversion)
Working with Data
Covers the basics of data entry, manipulation, and sorting. Emphasizes on efficient data management techniques.
Outline Data
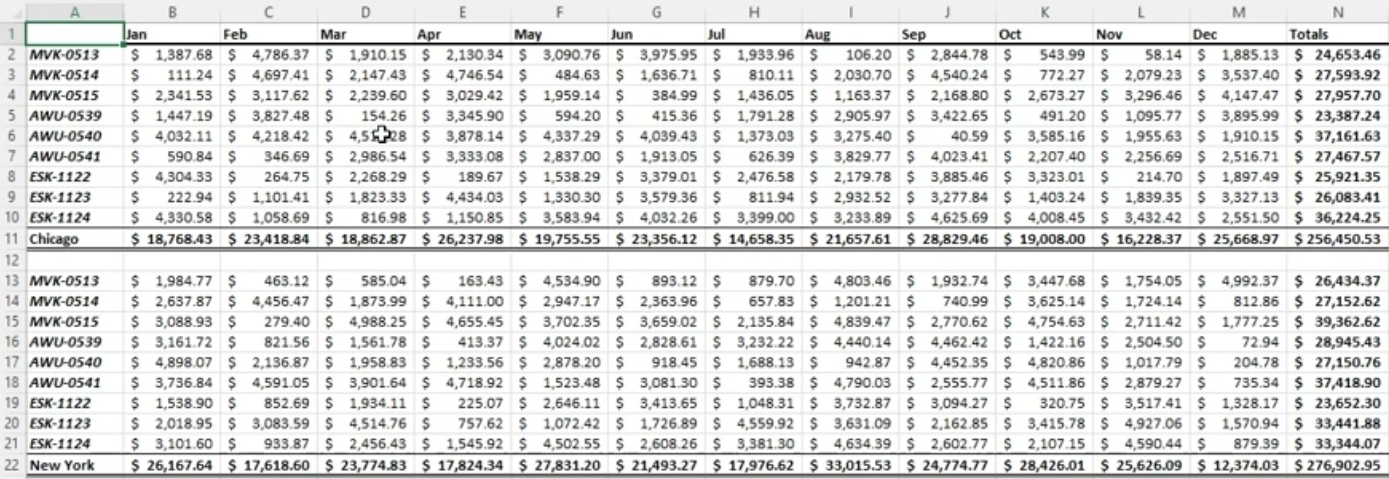
Group Data to Create Outlines
Data > Outline > Group/Ungroup

Insert Subtotals
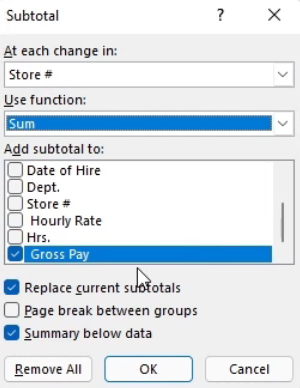
Get Subtotal Amount for a Specific Group
Data > Outline > Subtotal
First sort list by criteria to subtotal by.
Insert References
References Rows and Columns
- Relative reference example: =sum(C6:F6)
- Absolute reference example: =sum(G7*3)
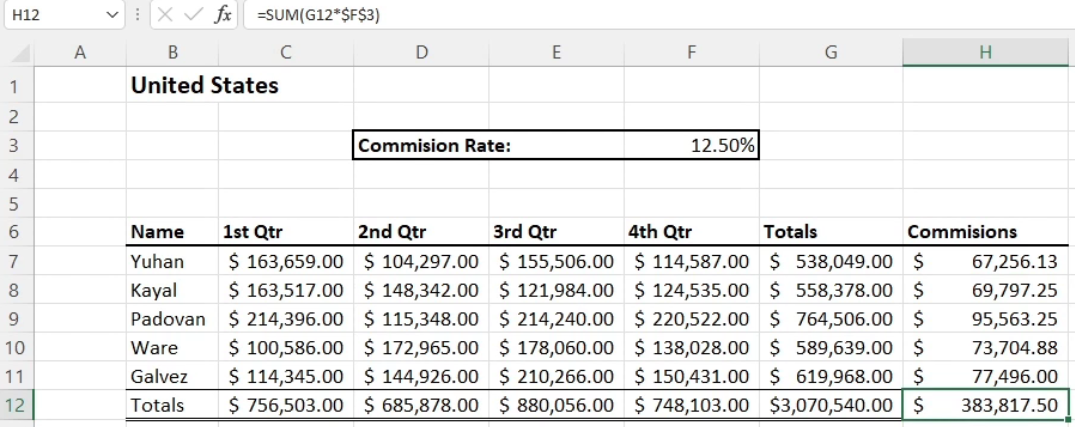
Reference Data by Using Structured References
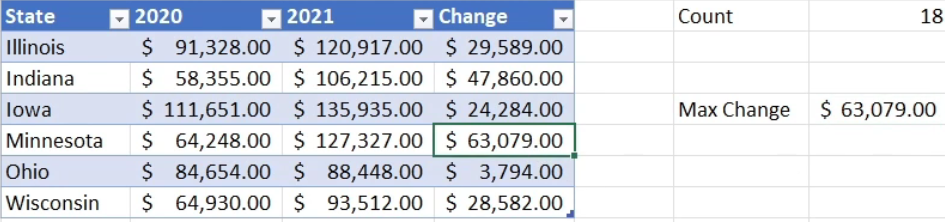
Reference Data by Use of Table Names
- Count of fields in table Sales: =COUNT(Sales)
- Max Change of values in table Sales: =MAX(Sales[Change])
Consolidate Data
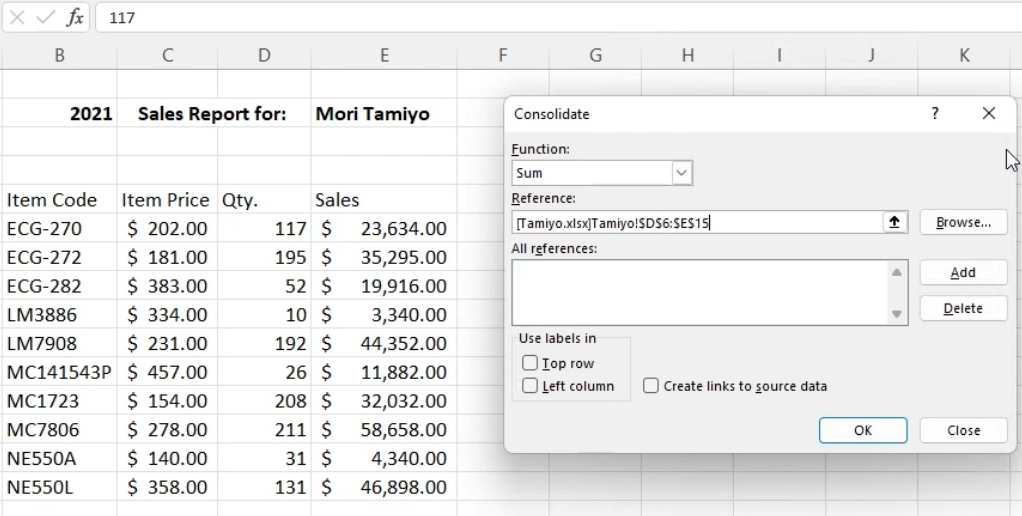
Consolidating Data From Multiple Workbooks
Data > Data Tools > Consolidate
Configure Data Validation
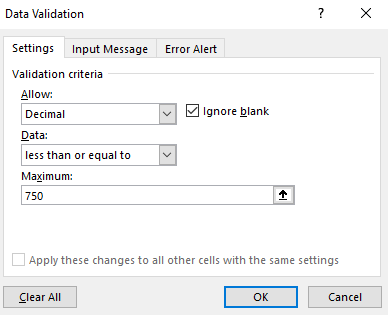
Limit User Inputs
Data > Data Tools > Data Validation
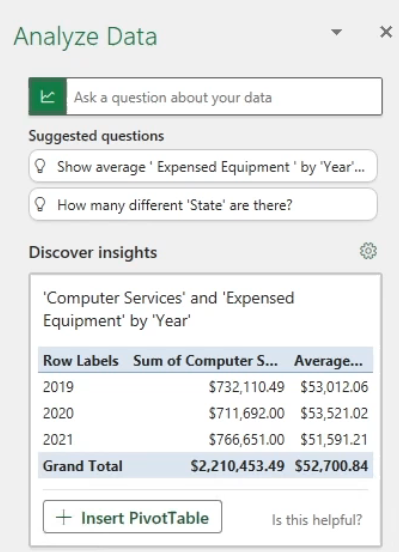
Analyze Data
Extract Information from Data
Home > Analysis > Analyze Data
- Create PivotTables, PivotCharts, Suggestions, etc..
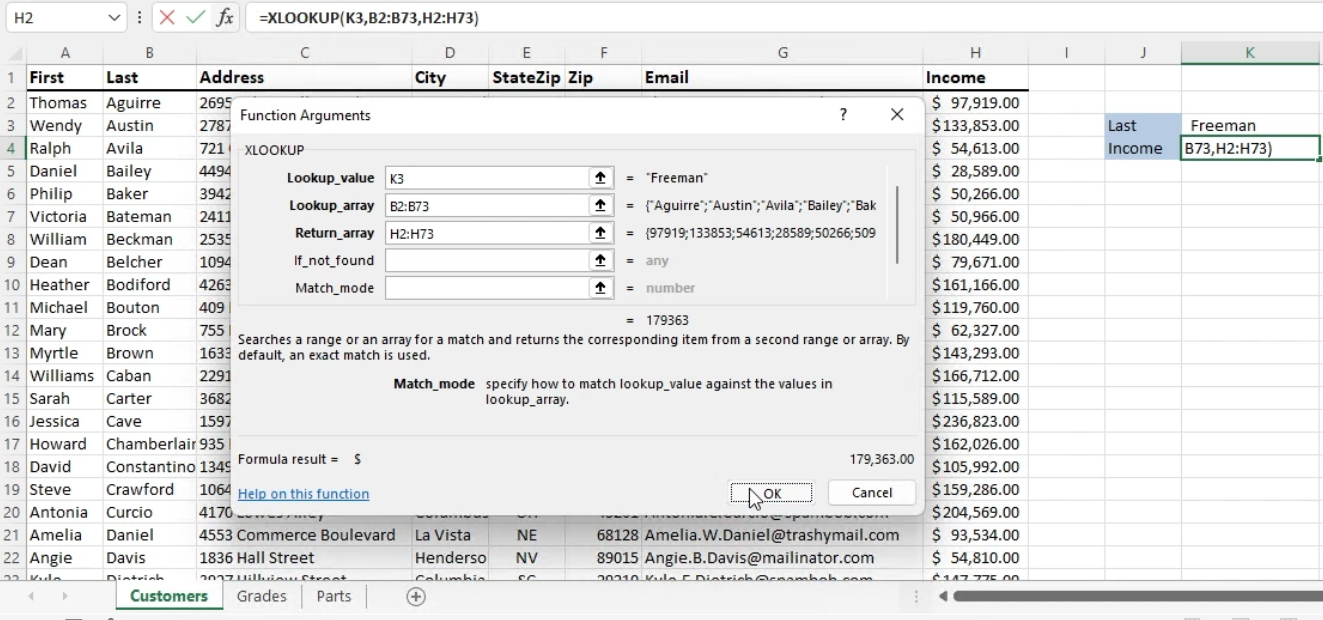
Look Up Data by Using the XLOOKUP Function
Successor to VLOOKUP, HLOOKUP, LOOKUP
Formulas > Function Library > Lookup & Reference > XLOOKUP
- Find return value in same row
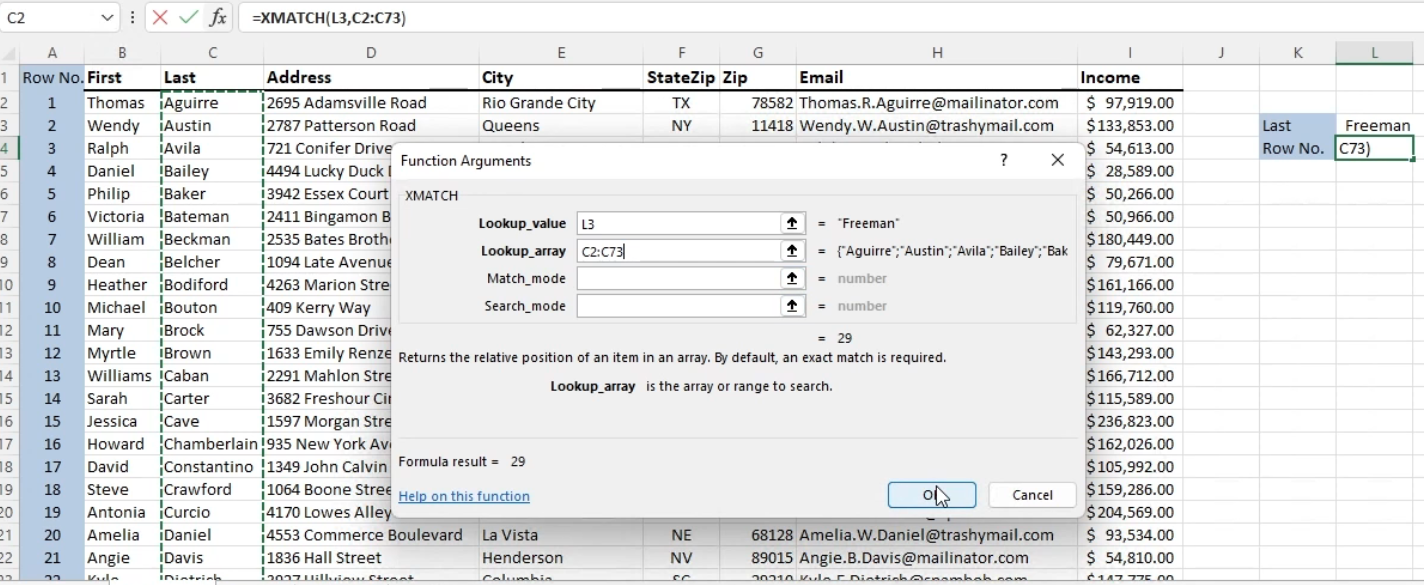
Look Up Data by Using the XMATCH Function
New Version of MATCH function
Formulas > Function Library > Lookup & Reference > XMATCH
- Perform a lookup and return a horizontal or vertical position
Power Query
Explains how to use Power Query for advanced data import and transformation. Highlights include merging and cleaning data sets.
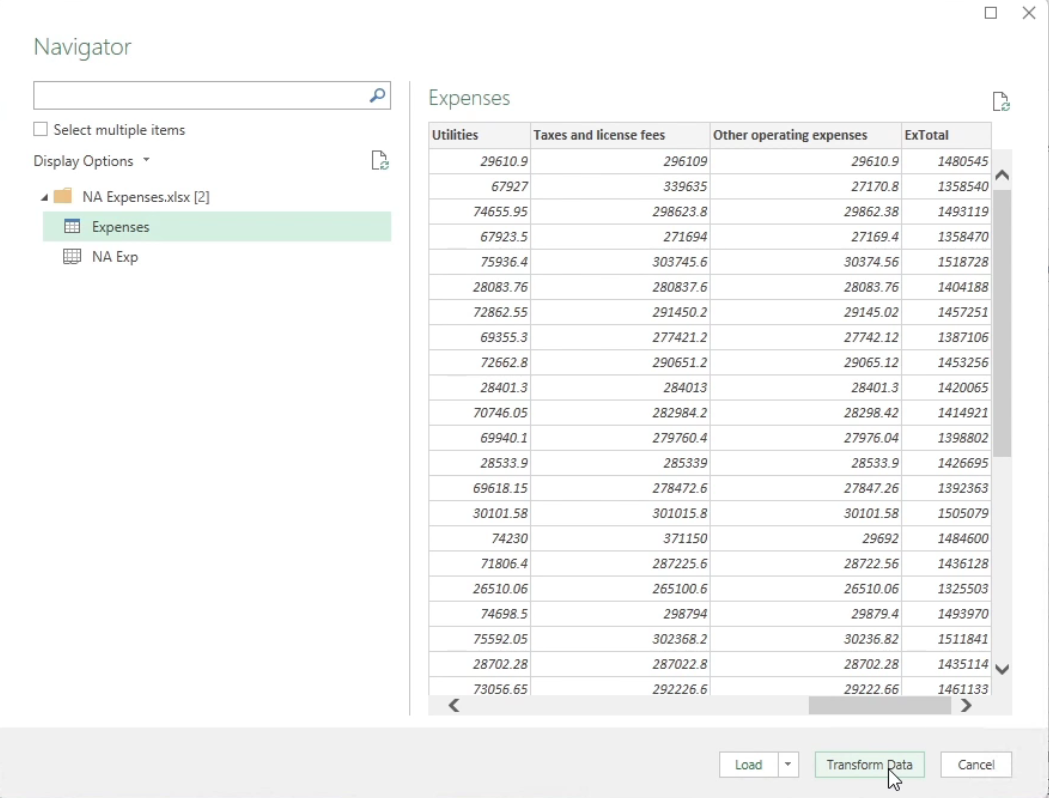
Import, Transform, and Connect to Data
Connect Data from Workbooks Using Power Query
Start with brand new workbook to import data to.
- Data > Get Data > From File
- Select Excel data file in Navigator and click Transform Data to open Power Query editor.
- Choose relevant columns
- Create connection by choosing Close & Load to
- Get Data from another workbook: Data > Get Data > From File
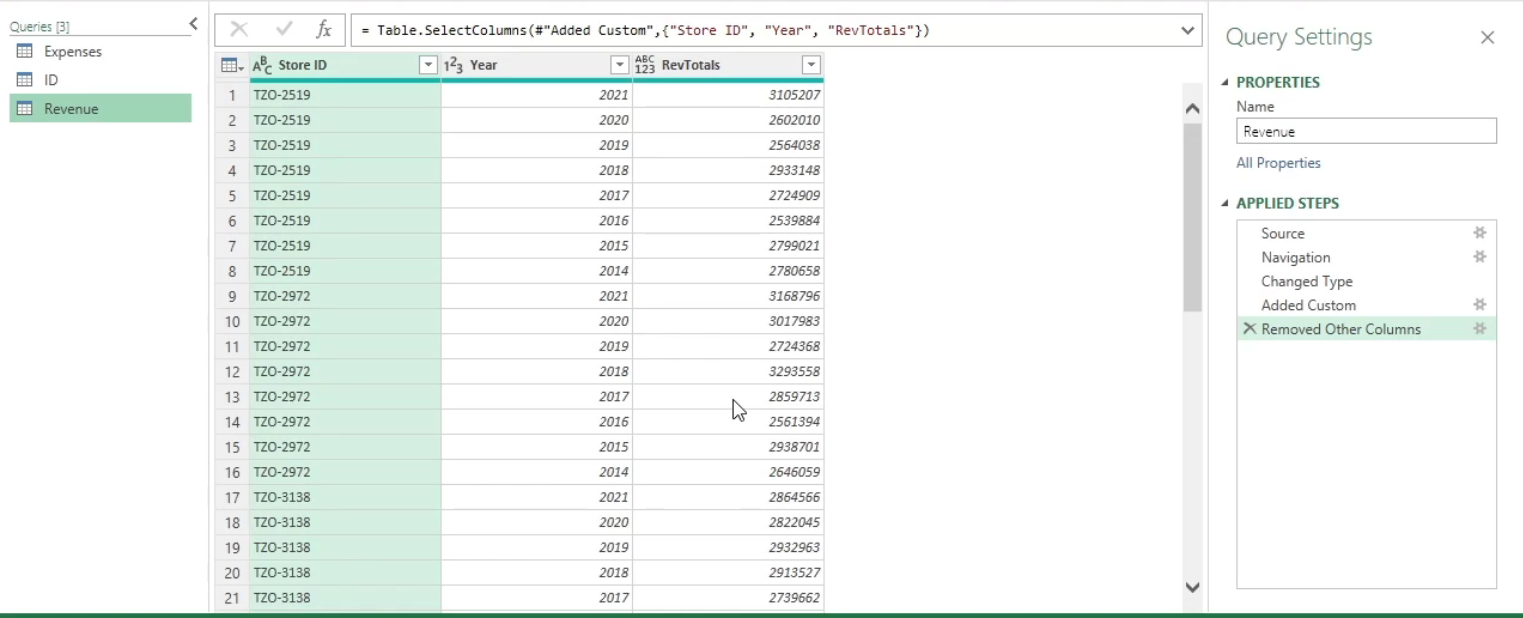
Combine and Display Data
Use Power Query to Combine and Display Data
Data > Get Data > Launch Power Query Editor
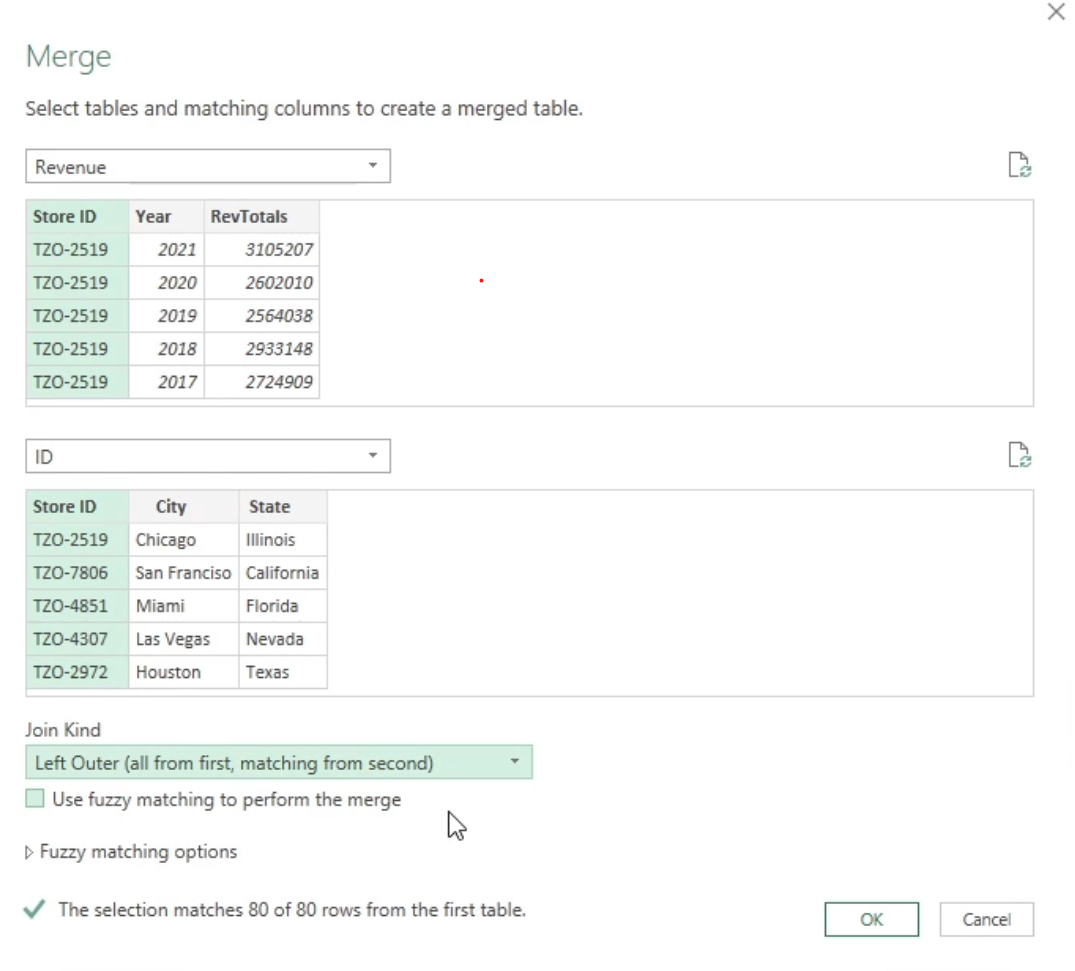
- Merge queries together and gather data into a single usable workbook.
- Home > Combine > Merge Queries
- Data > Combine Queries > Merge
Python
This blog marks the beginning of a new chapter in my professional life, one where I embrace the power of Python for data analysis, machine learning, and data science.
Python
Why Python? My aim is not just to learn a programming language but to unlock a new realm of possibilities in technology. Whether it’s understanding how data shapes decisions or exploring the wonders of artificial intelligence, Python seems to be the key. I want to build a strong foundation in programming, understand the basics of data analysis, and eventually explore the vast areas of machine learning and data science. I am intrigued by the stories of Python transforming careers and opening doors to new opportunities, and I hope to be one of those stories.
Motivations for Learning Python
Data Science: More Than Just Numbers: Data science is fascinating to me. It’s about turning a sea of data into insights and decisions. With Python, tools like Pandas and Matplotlib can help dissect and visualize data in ways that make sense and tell a story. It’s about uncovering the hidden narratives in data, and that’s something I really look forward to mastering.
Machine Learning: Machine learning is another topic I’m eager to explore. It’s about teaching computers to learn and make predictions based on data. With Python’s libraries like scikit-learn and TensorFlow, the possibilities seem endless. From recognizing patterns to predicting outcomes, the potential applications are vast and exciting.
Resources
- Dataquest Dataquest teaches Python syntax in the context of learning data science.
- Python Tutorial Tutorial on main Python site.
- Python Commands